Sales Forecasting System Using Machine Learning and Time Series Analysis
Businesses today generate huge amounts of sales data every single day. But raw numbers alone are not enough to make smart decisions. Companies need a way to understand trends, identify seasonal demand, and predict future sales accurately. This is where the Sales Forecasting System comes into the picture.
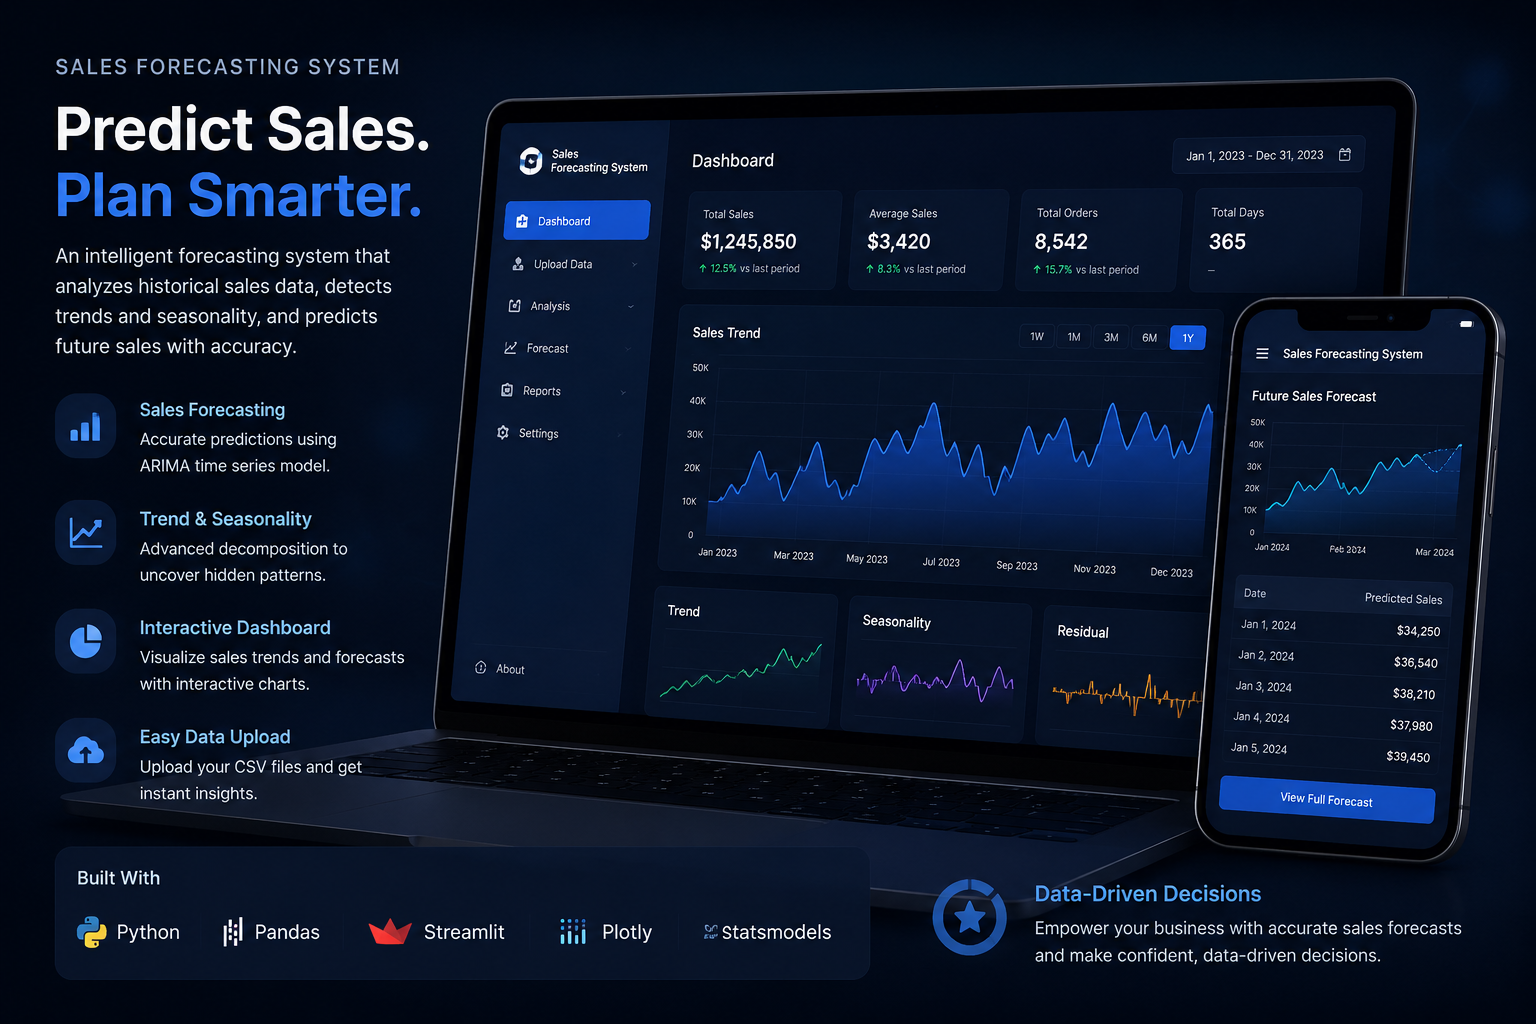
This project is designed to analyze historical sales data and forecast future sales using Machine Learning and Time Series Analysis techniques. The system helps businesses improve inventory planning, reduce losses, and make data-driven decisions.
The project was developed using Python along with modern data analysis and visualization libraries. An interactive dashboard was also created using Streamlit to provide a clean and user-friendly interface.
Objective of the Project
The main objective of this project is to predict future sales based on historical business data. The system studies past sales trends and patterns, then uses forecasting algorithms to estimate future demand.
The project helps businesses:
- Predict future sales performance
- Identify seasonal demand patterns
- Improve inventory management
- Reduce overstock and stock shortages
- Support business planning and decision-making
Technologies and Tools Used
The project was built using a combination of Machine Learning, Time Series Analysis, and modern visualization technologies.
Python
Python was used as the primary programming language because of its powerful data science ecosystem and simplicity for machine learning projects.
Pandas
Pandas was used for:
- Data cleaning
- Data preprocessing
- Handling missing values
- Grouping and aggregating sales data
- Time series transformation
It played a major role in converting raw sales records into a structured time-series dataset.
NumPy
NumPy was used for numerical computations and mathematical operations during forecasting and evaluation.
Plotly
Plotly was used to create interactive stock-market-style graphs. Unlike normal charts, Plotly provides:
- Zoom functionality
- Hover analysis
- Time-range filters
- Interactive trend exploration
This made the dashboard look modern and professional.
Streamlit
Streamlit was used to build the frontend dashboard for the project. It transformed the machine learning model into a real interactive web application where users can:
- Upload datasets
- View sales trends
- Analyze seasonal patterns
- Forecast future sales
Statsmodels
The Statsmodels library was used to implement the ARIMA forecasting model and perform seasonal decomposition.
Dataset Used
The project uses retail sales data that contains information such as:
- Order Date
- Product Details
- Sales
- Quantity
- Discounts
- Profit
The historical sales data acts as the foundation for forecasting future business performance.
How the Project Works
The system follows a complete machine learning workflow starting from data collection to future prediction.
Data Collection
The user uploads a CSV file containing historical sales data into the Streamlit dashboard.
Data Preprocessing
The raw dataset is cleaned before analysis. During preprocessing:
- Date columns are converted into datetime format
- Data is sorted chronologically
- Missing values are handled
- Daily sales are aggregated
This step is important because forecasting models require clean sequential data.
Time Series Creation
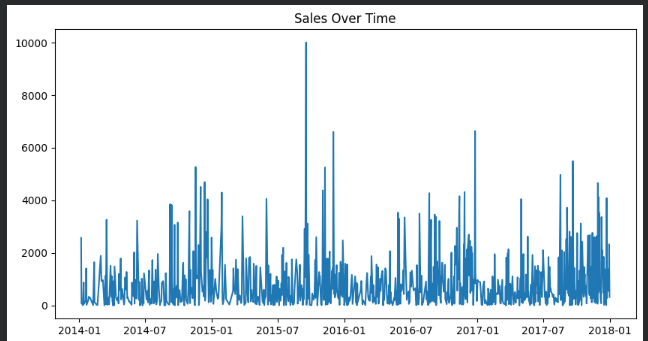
The project converts normal sales records into a time series format where sales are indexed by date. This allows the forecasting model to understand how sales change over time.
Data Visualization
Interactive graphs were created using Plotly to visualize:
- Sales growth
- Daily and monthly trends
- Seasonal fluctuations
The graph also includes stock-style controls such as:
- Zooming
- Time filters
- Range sliders
This makes analysis much more convenient and visually appealing.
Advanced Features Used in the Project
This project includes several advanced concepts that make it more than just a basic machine learning application.
ARIMA Forecasting Model
The core forecasting algorithm used in the project is ARIMA.
ARIMA stands for:
- AutoRegression
- Integrated
- Moving Average
It is one of the most popular algorithms for time series forecasting because it can learn patterns from historical data and predict future values effectively.
The model studies:
- Previous sales values
- Trends
- Sequential dependencies
Then it forecasts future sales for upcoming days.
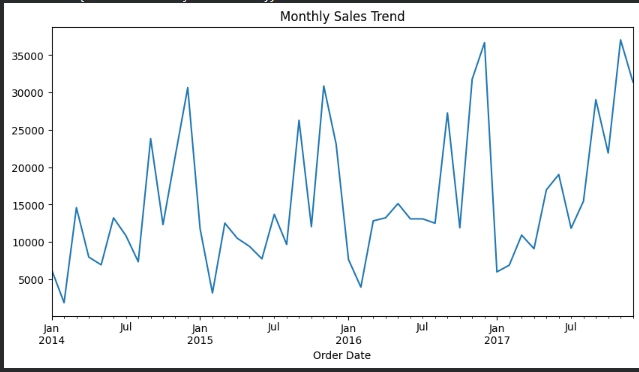
Seasonal Decomposition
One of the advanced parts of the project is Time Series Decomposition.
The system breaks sales data into three important components:
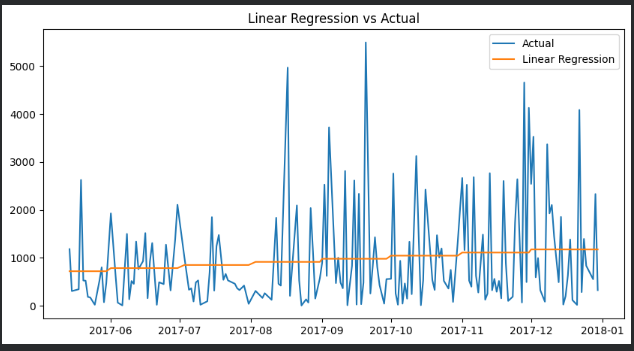
Trend:
Shows long-term increase or decrease in sales.
Seasonality:
Identifies repeating patterns such as monthly or festival sales increases.
Residual:
Captures random noise and unexpected fluctuations.
This helps businesses understand customer demand behavior more deeply.
KPI Dashboard
The dashboard displays important business metrics such as:
- Total Sales
- Average Sales
- Total Operational Days
These KPIs provide quick insights into business performance.
Interactive Forecast Dashboard
Unlike traditional static graphs, this project includes:
- Interactive Plotly charts
- Real-time filtering
- Stock-style timeline controls
- Smooth zooming and panning
This creates a professional user experience similar to business intelligence tools.
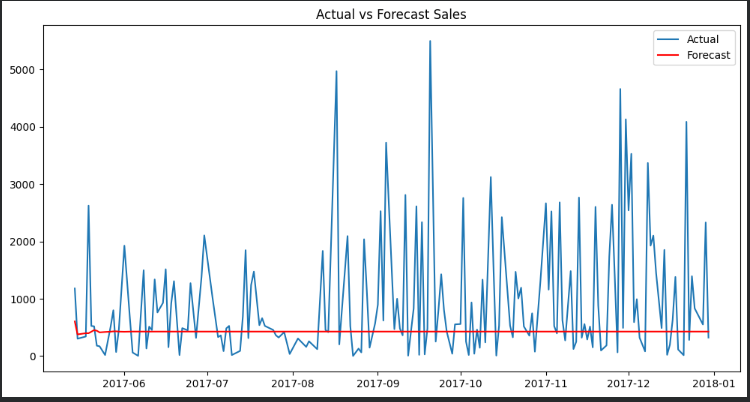
Forecasting Output
After training the ARIMA model, the system predicts future sales values for the next few days.
The output includes:
- Forecasted sales table
- Future trend visualization
- Time-based predictions
These predictions help businesses prepare inventory and marketing strategies in advance.
Why This Project Is Unique
This project is not just a simple prediction model. It combines:
- Machine Learning
- Time Series Analysis
- Interactive Visualization
- Dashboard Development
into one complete business solution.
The integration of Streamlit and Plotly makes the project look modern and industry-ready, while ARIMA and seasonal decomposition provide strong analytical capabilities.
Real-World Applications
This system can be used in:
- Retail businesses
- E-commerce platforms
- Supermarkets
- Inventory management systems
- Business analytics platforms
Any organization that wants to understand and forecast customer demand can benefit from this solution.
Conclusion
The Sales Forecasting System demonstrates how Machine Learning and Time Series Analysis can help businesses make smarter decisions. By analyzing historical sales patterns and predicting future demand, the system supports better inventory planning and business growth.
The project combines forecasting algorithms, interactive dashboards, and advanced visualization techniques to create a complete data-driven solution. It not only predicts future sales but also helps businesses understand trends and seasonal behavior more effectively.
RESULTS